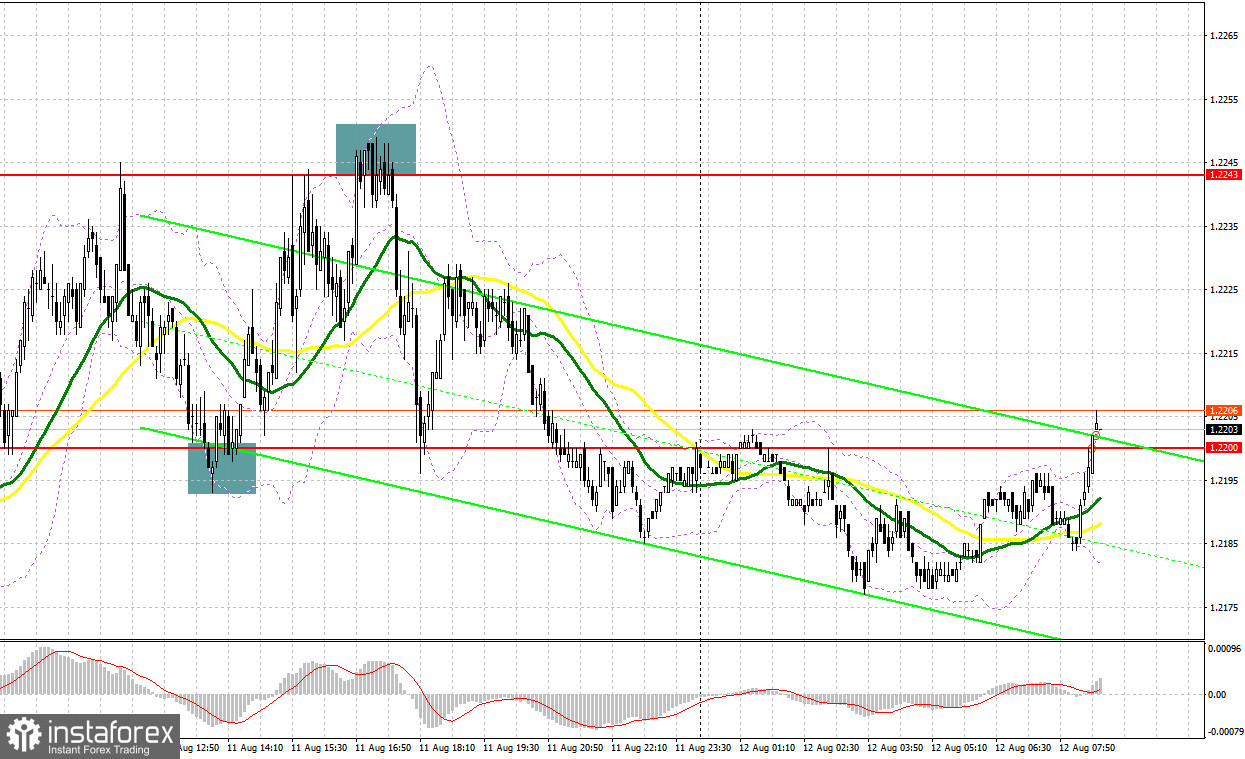
Yesterday, there were several excellent entry points. Now, let's look at the 5-minute chart and try to figure out what actually happened. In the morning article, I highlighted the level of 1.2214 and recommended making decisions with this level in focus. The pound/dollar pair climbed and broke through 1.2214 in the first half of the day. However, the pair performed an upward test in the middle of the European session. A buy signal appeared but traders managed to get profit from it only in the middle of the European session after another false breakout occurred near the support level of 1.2200. I paid attention to this level. As a result, the pair grew by more than 40 pips. The pair failed to consolidate above 1.2243, which gave a sell signal. So, the pair dipped to 1.2200.
What is needed to open long positions on EUR/USD
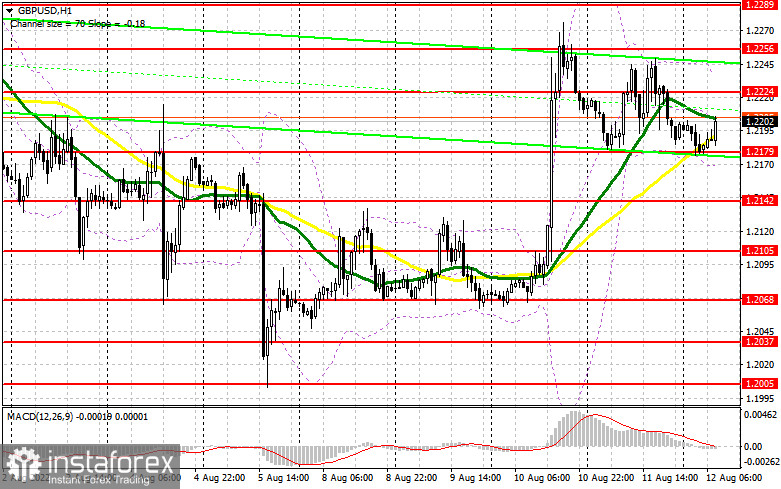
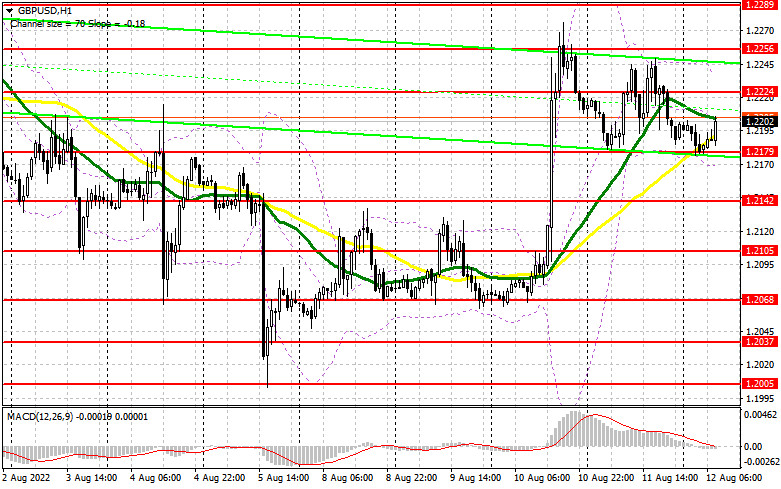
The US Procure Price Index fell sharply thanks to lower energy prices. Hence, demand for the pound sterling remained high. The US dollar weakened even more. Today, traders are shifting their attention to UK GDP data. If the reading is in line with forecasts and the UK economy contracts in the 2nd quarter of this year, traders will hardly start getting rid of the pound sterling. It could sink considerably if the report causes panic, e.g. a larger drop in GDP in July by 2.0% at once or zero annual growth. It is also crucial to pay attention to the UK industrial production and the trade balance reports. If the pair declines in the first half of the day after the reports, the optimal scenario for opening long positions will be a false breakout of 1.2179. At this level, the moving averages are passing in positive territory. If this scenario comes true, GBP/USD may jump to 1.2224 and a break through this level. A downward test of 1.2224 will trigger a new uptrend. Therefore, the price is likely to reach the long-term target level of 1.2256 where I recommend locking in profits. If GBP/USD falls and buyers show no activity at 1.2179, the pressure on the pound sterling will escalate again at the end of this week. As a result, the bears may assert strength. They are sure to try to weaken the rally. In this case, it is better to postpone long positions to 1.2142. I advise you to open long positions at this level only on a false breakout. You can buy GBP/USD immediately after a bounce from 1.2105 or a low of 1.2068, keeping in mind an upward intraday correction of 30-35 pips.
What is needed to open short positions on EUR/USD
Sellers are likely to remain cautious, counting on a weak GDP report. The best option for opening short positions would be a rise from the resistance level of 1.2224. However, we need a false breakout of this level. It will give a good entry point. Thus, the price is likely to decline to the nearest support level of 1.2179. The bulls and bears are likely to tussle for this level as large traders are defending this range. Only a breakout and an upward test of 1.2179 will generate an entry point with the prospect of a drop to 1.2142. A more distant target will be the 1.2116 level where I recommend locking in profits. If GBP/USD moves higher and bears show no energy at 1.2224, which is likely if the GDP data is positive, buyers will get the chance to return the price to 1.2256. Only a false breakout of this level will provide a sell signal amid the pair's downward movement. If the bears fail to defend this range, the pair may jump to a high of 1.2289. You can sell GBP/USD immediately at a bounce, keeping in mind an intraday downward correction of 30-35 pips.
COT report
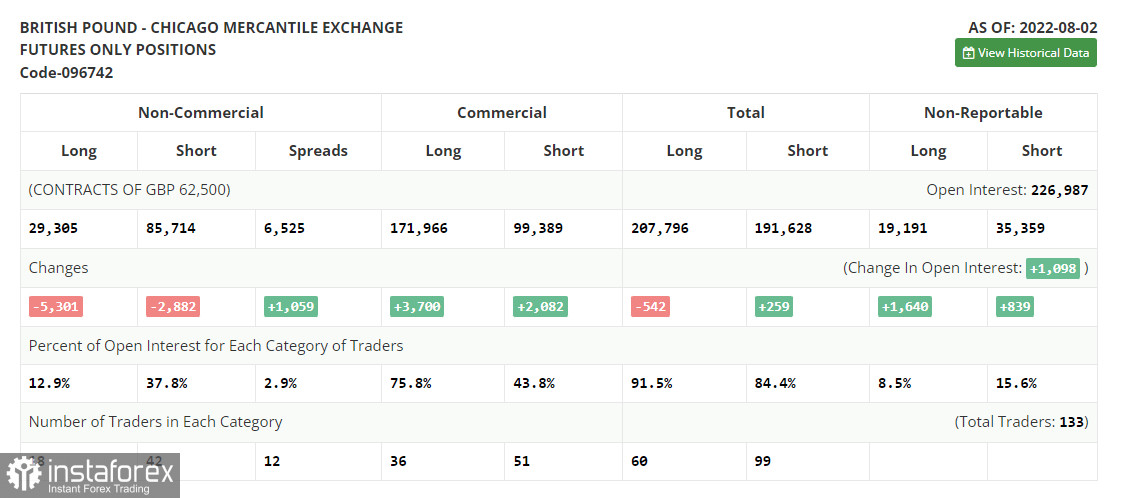
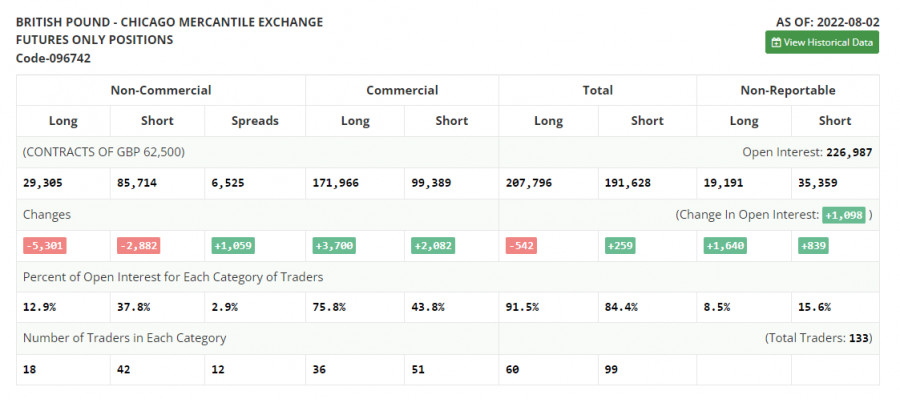
The COT report (Commitment of Traders) for August 2 logged a drop in both short and long positions. However, there was a bigger decline in long ones, which led to an increase in the negative delta. It means that many traders are still worried about the prospects of the UK economy as well as the outcome of the BoE's hawkish monetary policy. Last week, the regulator raised the interest rate by 50 basis points at once, which was the most significant change in policy over the past 27 years. Apparently, the central bank is ready to face slowing economic growth, which is rapidly shrinking, to rein in soaring inflation. According to forecasts, in October, inflation is expected to reach 13.0%. However, it is the reason to lose faith in the pound sterling, which is quite oversold against the US dollar. If the US inflation data is positive, the GBP/USD pair may resume an upward movement. The COT report revealed that the number of long non-commercial positions decreased by 5,301 to 29,305, while the number of short non-commercial positions slid by 2,882 to 85,714. It led to an increase in the negative delta of the non-commercial net position to of -56,409 from -53,990. The weekly closing price jumped to 1.2180 against 1.2043.
Signals of technical indicators
Moving averages
EUR/USD is trading above 30- and 50-period moving averages, signaling strong bullish bias.
Remark. The author is analyzing the period and prices of moving averages on the 1-hour chart. So, it differs from the common definition of classic daily moving averages on the daily chart.
Bollinger Bands
In case of a rise, 1.2240 will act as resistance. In case of a decline, the lower border of 1.2165 will act as support.
Definitions of technical indicators
- Moving average recognizes an ongoing trend through leveling out volatility and market noise. A 50-period moving average is plotted yellow on the chart.
- Moving average identifies an ongoing trend through leveling out volatility and market noise. A 30-period moving average is displayed as the green line.
- MACD indicator represents a relationship between two moving averages that is a ratio of Moving Average Convergence/Divergence. The MACD is calculated by subtracting the 26-period Exponential Moving Average (EMA) from the 12-period EMA. A 9-day EMA of the MACD called the "signal line".
- Bollinger Bands is a momentum indicator. The upper and lower bands are typically 2 standard deviations +/- from a 20-day simple moving average.
- Non-commercial traders - speculators such as retail traders, hedge funds and large institutions who use the futures market for speculative purposes and meet certain requirements.
- Non-commercial long positions represent the total long open position of non-commercial traders.
- Non-commercial short positions represent the total short open position of non-commercial traders.
- The overall non-commercial net position balance is the difference between short and long positions of non-commercial traders.